Using the Chariot UI
The Chariot user interface (UI) provides an intuitive way to query and visualize Inference Store data without writing code. It's ideal for quick exploration, basic filtering, and understanding your data at a glance.
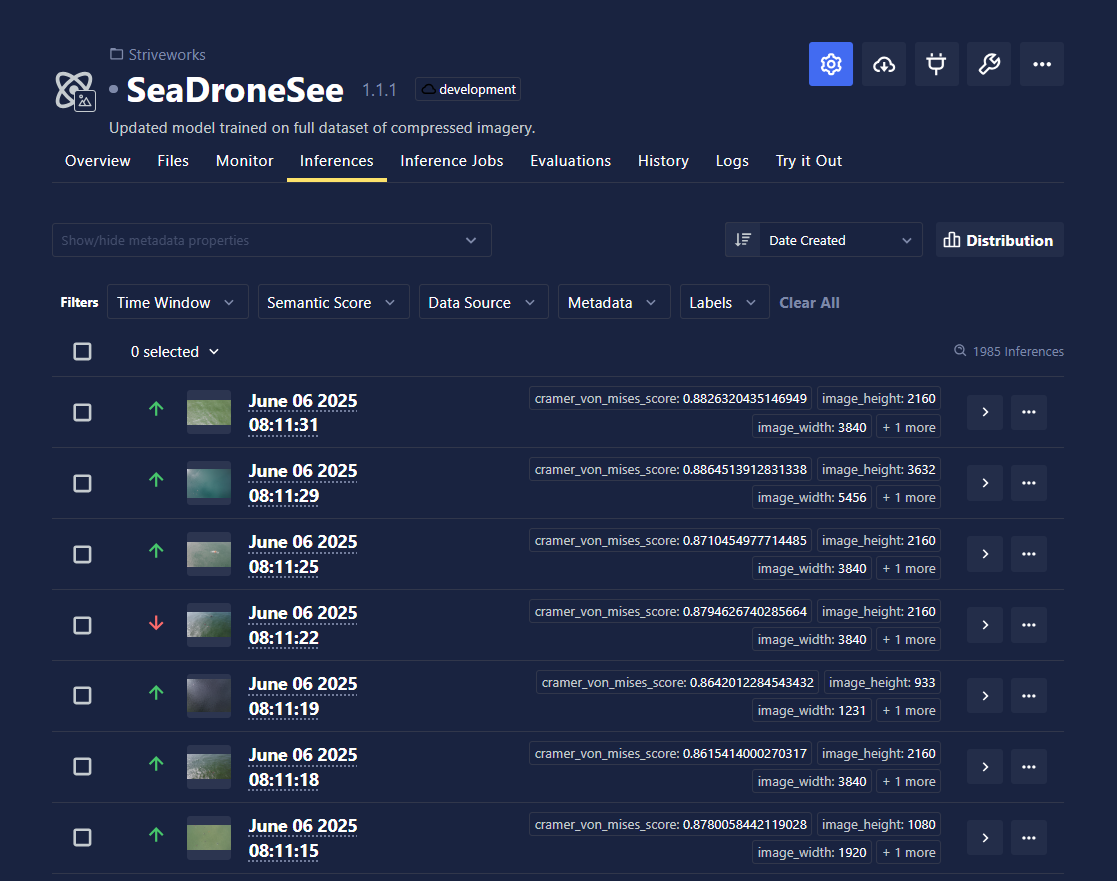
Accessing Inference Data
Currently, the UI supports viewing inferences for one model at a time. To view your inferences:
- Navigate to the model whose inferences you want to explore.
- Click the Inferences tab.
- Use the available filters to narrow down your results.
From this interface, you can view inferences and filter them by time, semantic score, labels, and other metadata.
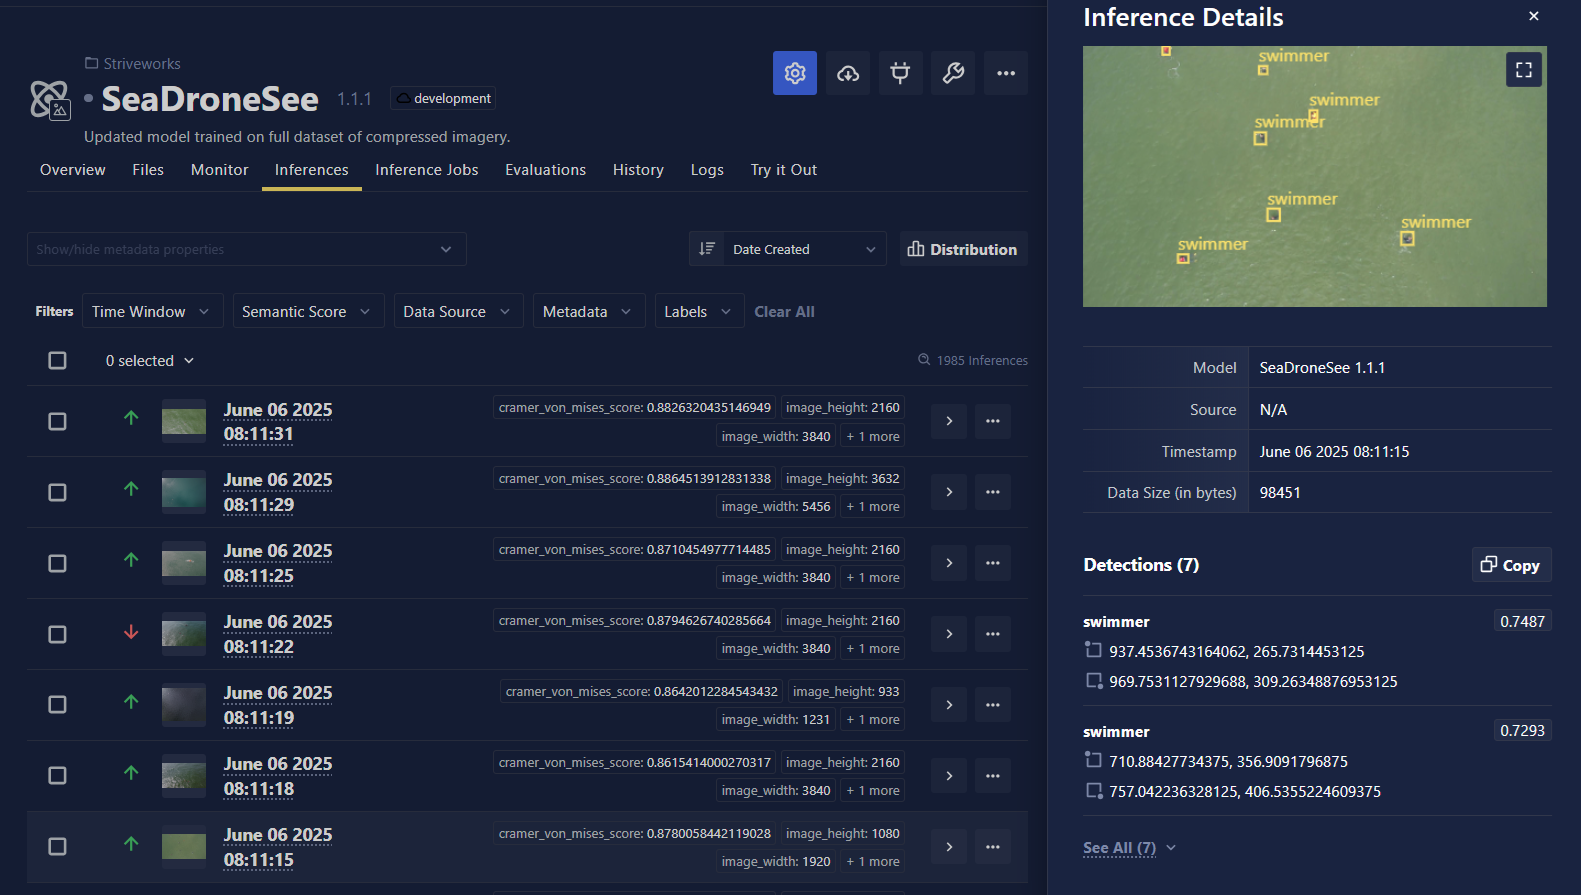
For more details and to visualize inference results, click the View Details expansion button for the selected inference.
Available Filters
The UI provides several built-in filters to help you find specific inferences:
- Time Range: Filter by when the inference was made.
- Semantic Score: Filter by semantic similarity scores.
- Data Source: Filter by the source of input data.
- Metadata: Filter by custom metadata attached to inferences.
- Labels: Filter by detected labels in the inference results.
- Confidence Score: Filter by model confidence levels.
- Image Search: Search for similar images by embedding distance.
When the image search filter is used, only inferences in the Inference Store with an associated embedding will be returned. To generate embeddings for your Inference Store images, enable Semantic Test drift monitoring. Embeddings from the semantic test will not be generated retroactively; you must enable this setting before inferences are made.
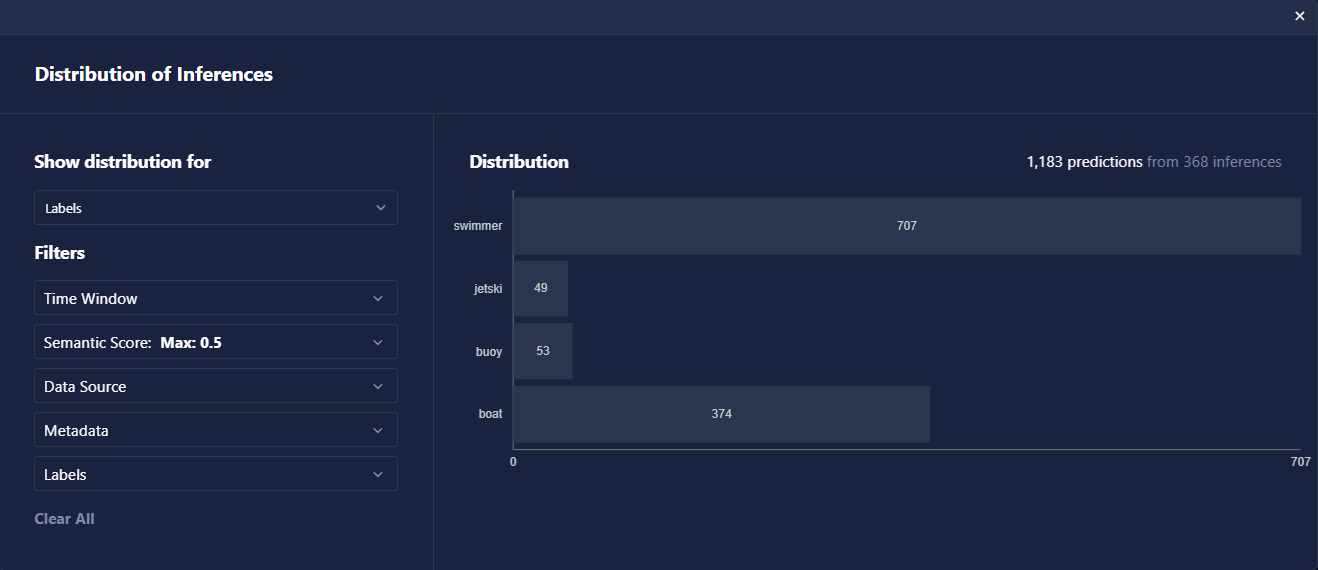
Visualizing Results
Use the Distribution button to open a graph showing the distribution of model predictions based on your selected filters. This is helpful for understanding patterns in your data and model performance.