Model Monitoring
Chariot captures runtime metrics for Inference Servers including latency, system utilization, errors, and throughput. To view them, navigate to the Models page and select the Monitor tab.
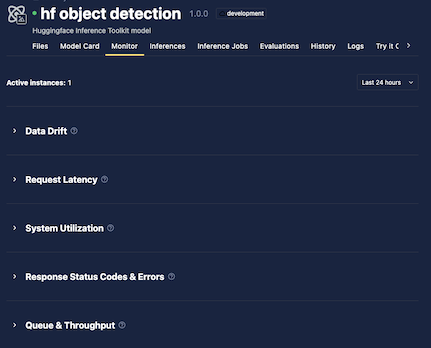
The top of the Monitor tab shows the number of running instances and a time range selector. Historical data availability depends on your deployment but is generally up to 60 days.
Metrics are organized into five collapsible sections. Select any section header to expand or collapse it.
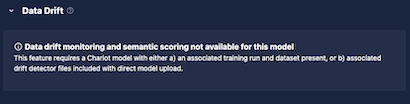
Data Drift
When drift detection is enabled, drift results appear in this section. See Drift Detection for details.
If drift detection is not enabled, a message is displayed.
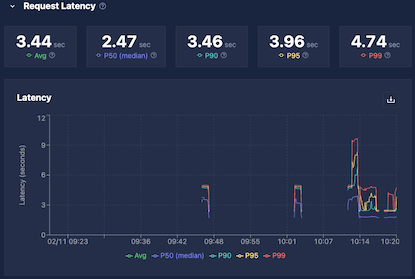
Request Latency
Request latency is captured in a histogram and displayed as aggregate statistics over the selected time range. Empty intervals indicate periods with no inference requests.
| Metric | Description |
|---|---|
| Average | Total processing time divided by number of inferences |
| Median (P50) | 50% of requests completed at or below this time |
| P90 | 90% of requests completed at or below this time |
| P95 | 95% of requests completed at or below this time |
| P99 | 99% of requests completed at or below this time |
Use these values together to assess whether your model meets latency requirements across typical and worst-case requests.
System Utilization
The System Utilization section shows resource usage for the Inference Server:
| Metric | Description |
|---|---|
| GPU Utilization | Percentage of time that the GPU's compute cores (streaming multiprocessors [SMs]) were actively executing work during the sampling window. Reflects the fraction of time at least one task was running on the GPU and is more representative of sustained activity than instantaneous GPU utilization. Based on DCGM_FI_PROF_SM_ACTIVE. Empty for CPU-only models. |
| VRAM | GPU memory usage. Empty for CPU-only models. |
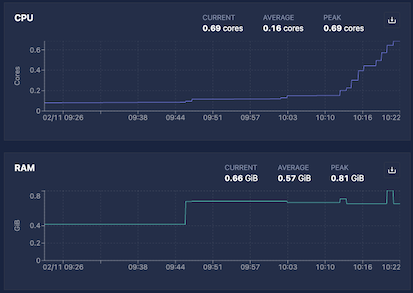
| CPU | Processor utilization across all cores. |
| RAM | System memory usage. |
If utilization is consistently at the maximum, consider allocating more resources. If utilization is very low, consider reducing allocated resources.
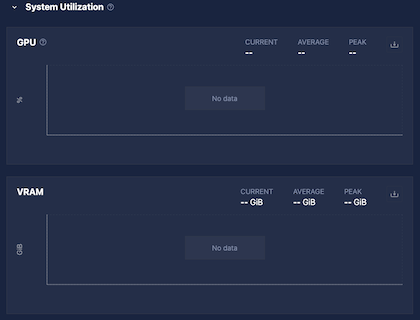
On some installations, Chariot may not have permission to capture system utilization. In those cases, these values will always be blank.
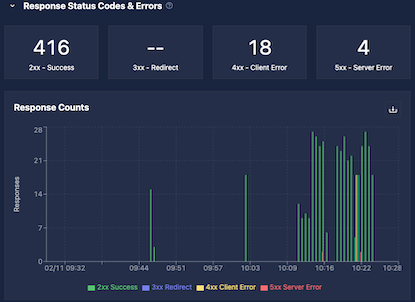
Response Status Codes
Each inference request returns an HTTP status code, grouped into four buckets:
| Code range | Meaning |
|---|---|
| 2xx | Success |
| 3xx | Redirection (rare for Inference Servers) |
| 4xx | Bad request (invalid data, authorization errors) |
| 5xx | Server error (including rate limiting) |
The top of the Response Status Codes section of the monitoring UI shows total counts per bucket for the selected time range, followed by a time-series graph.
Status code counts are stored in histogram buckets chunked by time. Off-by-one discrepancies can occur near bucket or time boundaries. Adjusting the time range may help.
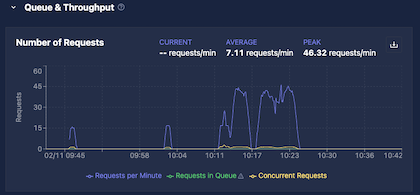
Queue and Throughput
The Queue and Throughput section shows three metrics:
| Metric | Description |
|---|---|
| Requests Per Minute | Rate of incoming requests; shown as current, average, and peak over the selected time range |
| Requests in Queue | Requests waiting to be forwarded to the Inference Server |
| Concurrent Requests | Requests currently being processed by the Inference Server |
Max Concurrent Requests
The Max Concurrent Requests Inference Server setting controls how many simultaneous requests Chariot forwards to each Inference Server instance. The queue is also per instance; each running instance maintains its own independent queue with a capacity of 10× the max concurrent requests value.
| Setting | Behavior (per instance) |
|---|---|
Unset or 0 | All requests are forwarded directly; no queue is used; concurrent requests may exceed 1 under load |
Positive value N | Up to N requests run concurrently; up to 10N requests are held in queue; excess requests receive an HTTP 503 error |
Incoming requests are load balanced across all running instances. This means that the total system capacity scales with the number of instances: With five instances and max concurrent requests set to 1, each instance holds up to 10 queued requests, giving the system a total capacity of 50 open requests at once.
Requests can remain in queue for up to 30 seconds before being rejected.
Example: With a single instance and max concurrent requests set to 2, Chariot allows two simultaneous requests and holds up to 20 in queue (10×). If 25 requests arrive at once and each takes one second to complete:
- Requests 1–2 are forwarded to the model immediately (concurrent slots full).
- Requests 3–22 are held in queue.
- Requests 23–25 arrive with both concurrent slots and the queue full, and receive an immediate HTTP 503 error.
As each request is completed, Chariot pulls the next one from the queue until it empties. Adding more instances would increase both the concurrent and queue capacity proportionally.
Interpreting the Metrics
Use Requests in Queue and Concurrent Requests, together with Requests Per Minute and latency, to assess whether your deployment is appropriately sized:
- High queue depth or frequent 503 errors indicate the need for more Inference Server instances.
- Consistently low utilization may indicate over-provisioning.
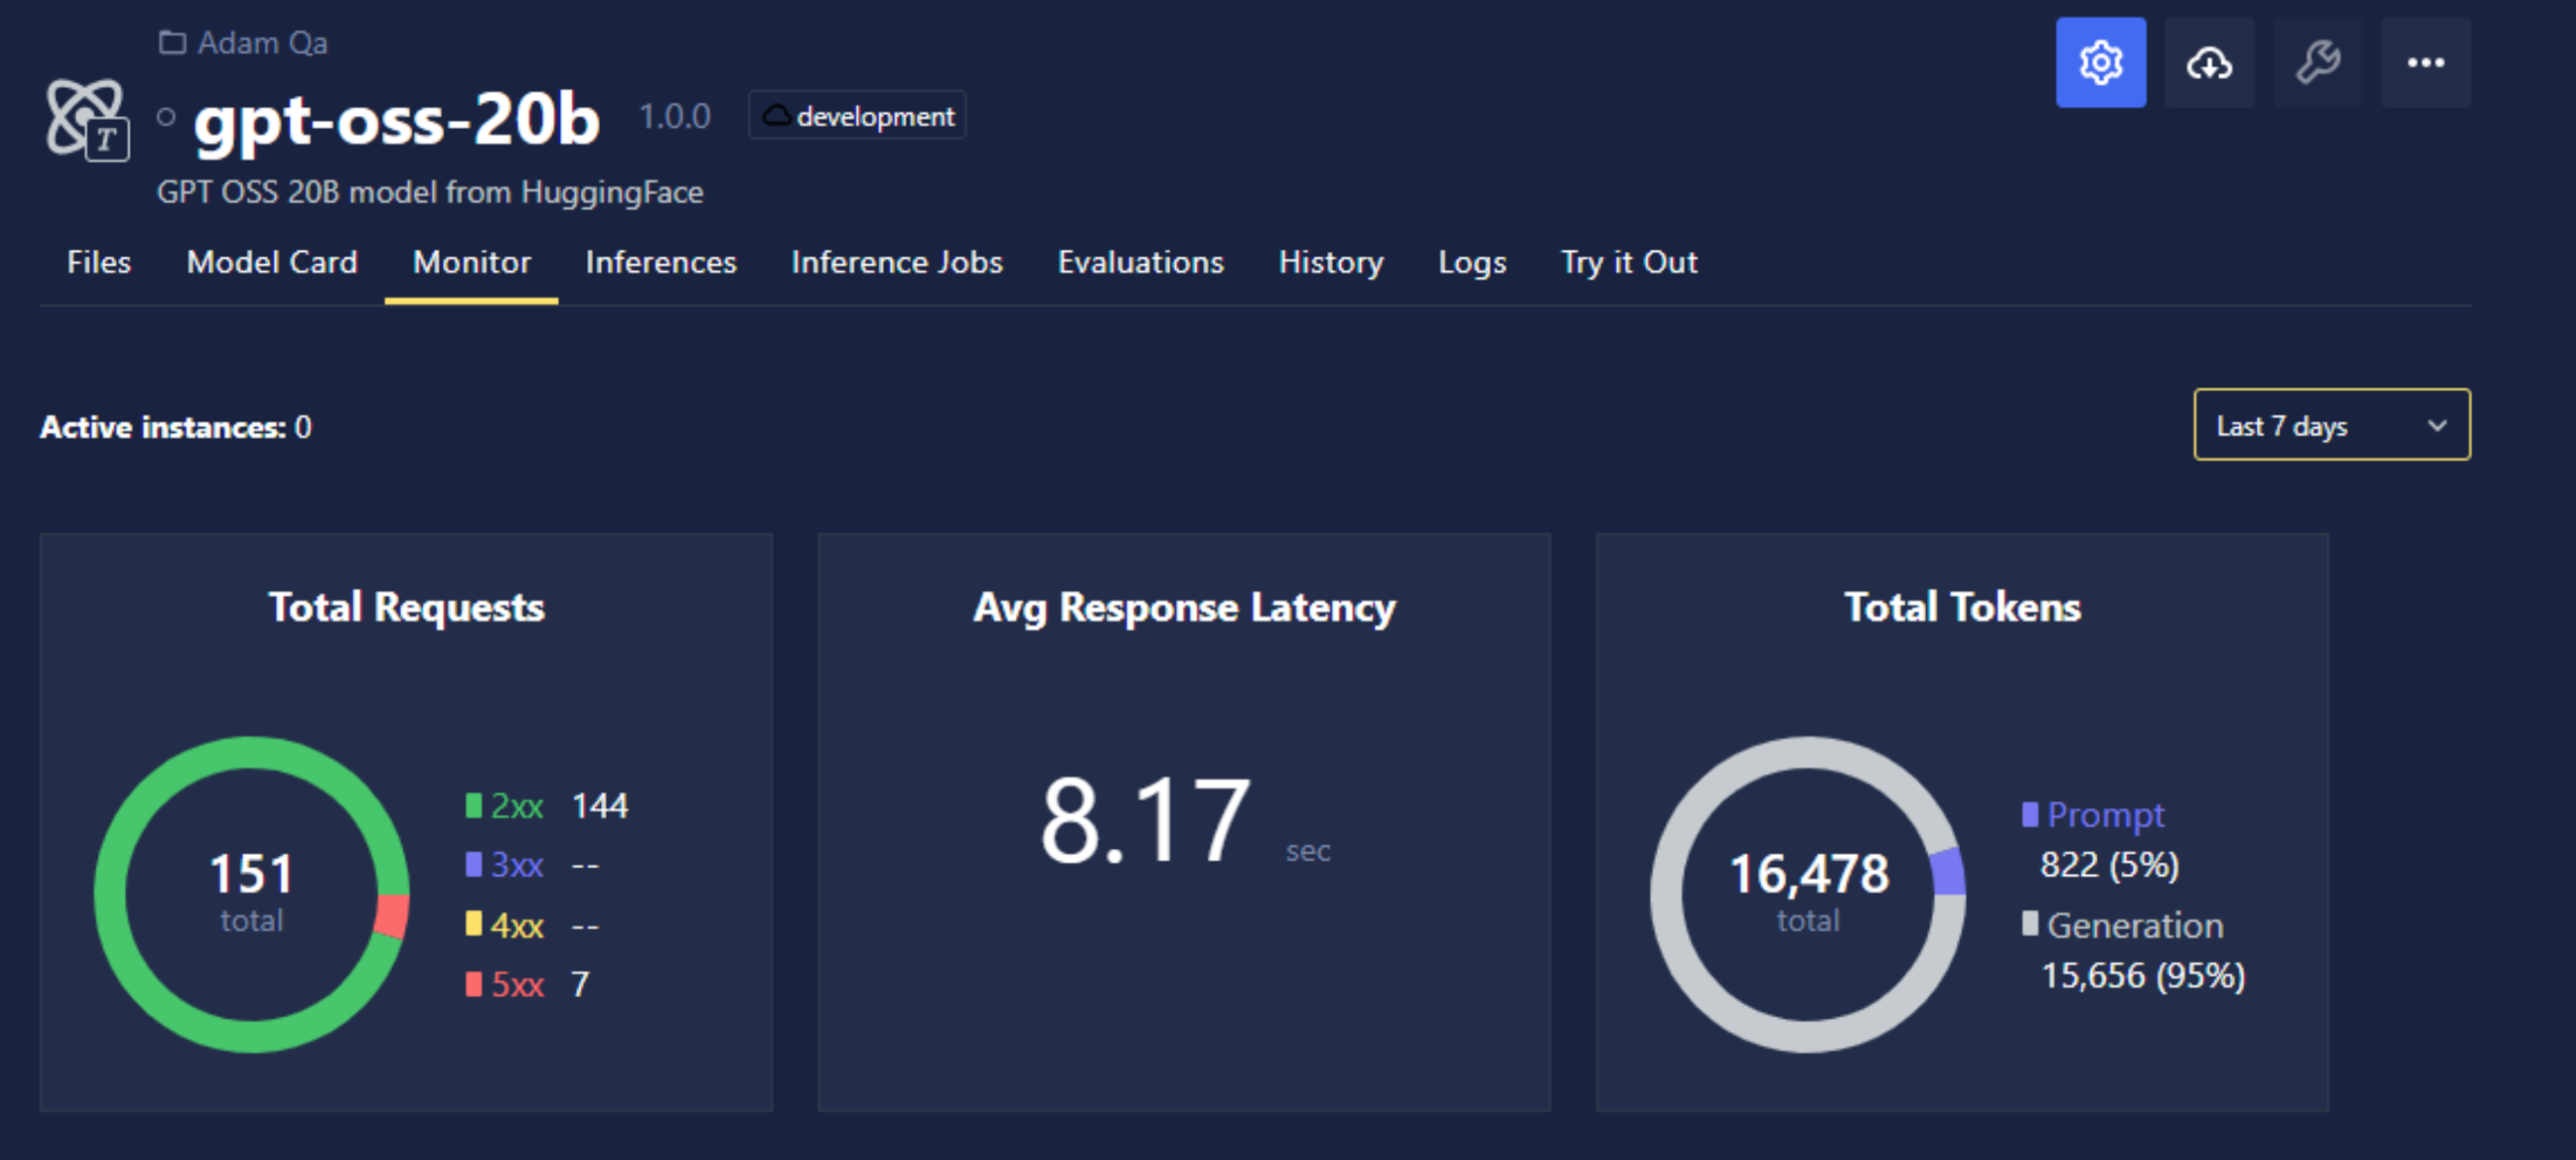
Language Model Metrics
For large language models (LLMs) and vision language models (VLMs), the Monitor tab can show extra metrics that apply to tokenized inference, such as total tokens processed (prompt plus generation).
Tokens Processed
| Metric | Description |
|---|---|
| Prompt tokens | Total number of prompt tokens processed over the selected time range |
| Generation tokens | Total number of generated (output) tokens over the selected time range |